Business Analytics Dashboard
Overview
Organizations that have businesses running in various verticals have information generated across all domains. Not having a shared dashboard to analyze statistics at a glance makes it difficult for the organization to get a holistic view of its business and revenue.
This app visualizes the use case of a car showroom business with maintenance verticals. The template can help pool data from various data sources into one dashboard, enabling stakeholders to analyze critical metrics across all business verticals in one place.
Highlights of the app
- Users can view the showroom deals by a server-side paginated list and search through this list.
- Users can update fields in a showroom deal using the form.
- Users can view the repair and maintenance deals by a server-side paginated list and can search through the list.
- Users can update fields in a repair deal using the form.
- Users can pool data from various data sources in a dashboard.
- Users can see the statistics of the deals and revenue generated.
- Users can visualize the data using charts and progress bars for various parameters.
Related Templates
Applicant Tracker
Review applications, schedule interviews using the Google Calendar API, & share interview feedback.

Bugs and Issues Manager
Create and track issues, bug reports and collect related screenshots using Airtable to store data and files.

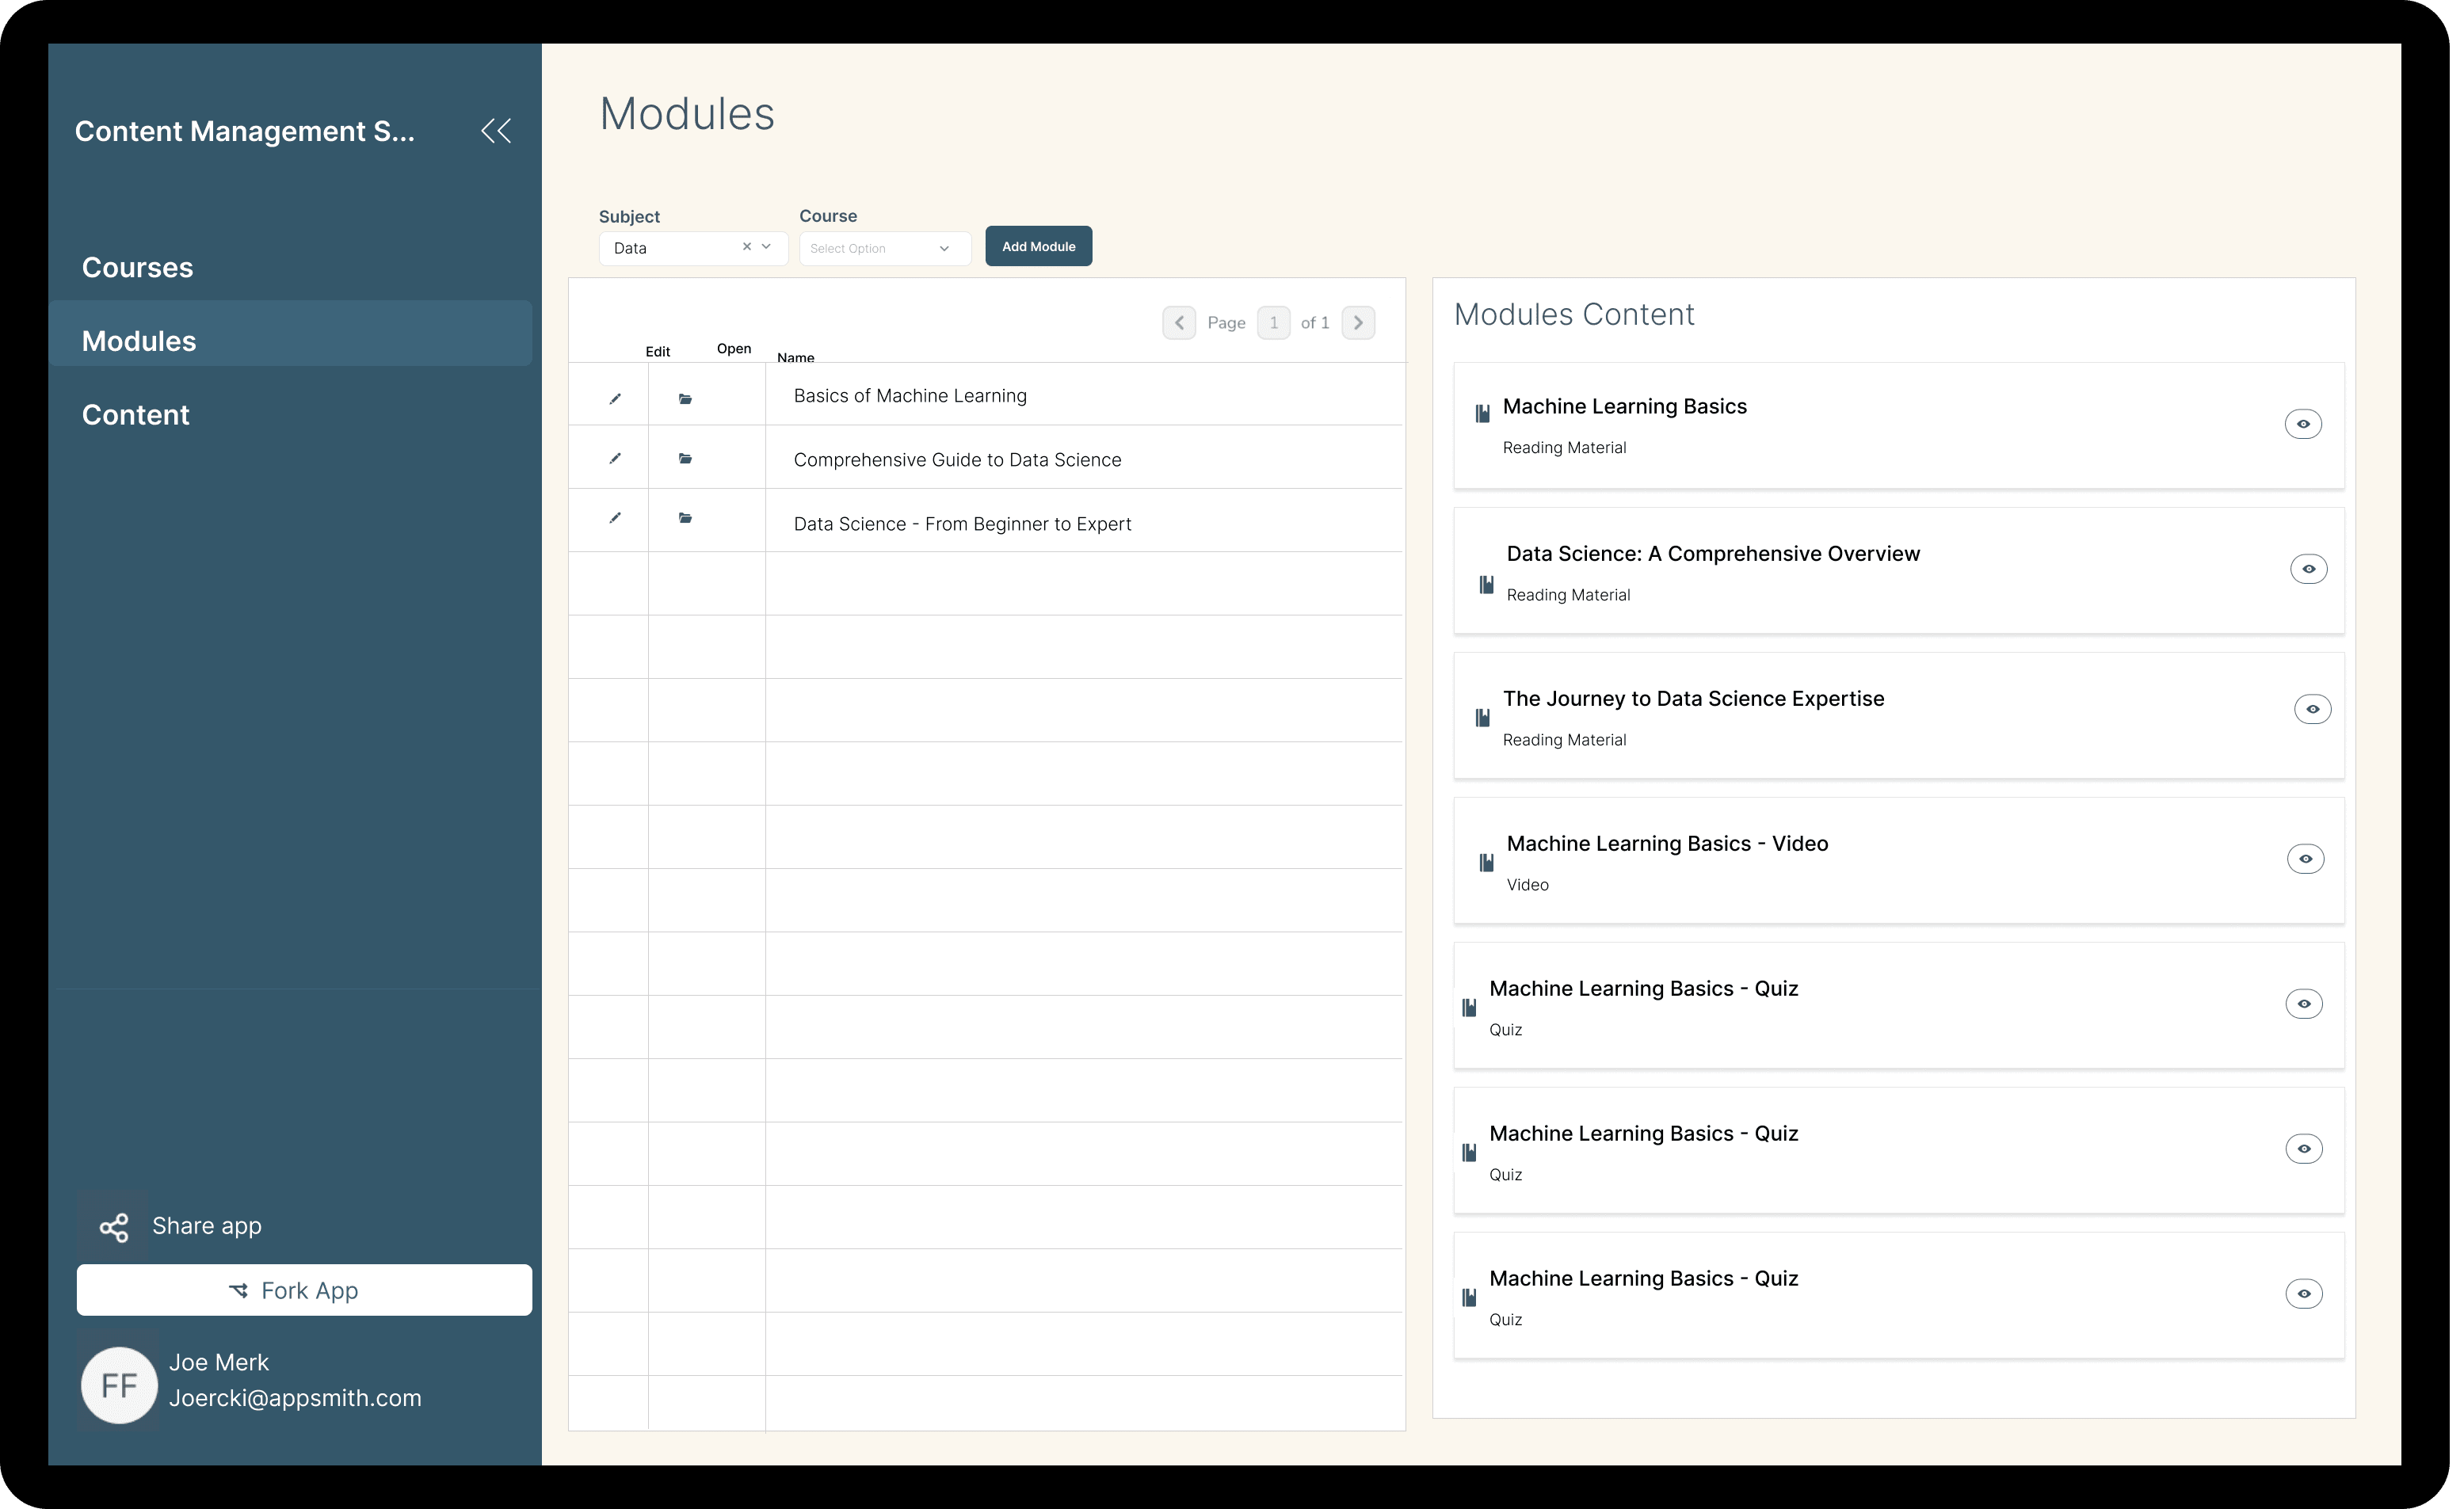
Content Management System
App for instructors and curriculum designers to manage and upload academic content for their courses